


The process starts bottom left with trees, grasses or herbs producing pollen, which become airborn.

Step 1. Collect & fix pollen

Collecting these pollen from the air with some kind of vacuum cleaner. Of course the volume of air processed in a certain period of time is important since you want information about the concentration of pollen in the air.
Step 2: create an image

As pollengrains are very, very small you’ll need a microscope to see unique details to identify specific species of pollen. When using a microscope it’s important to fix the pollen on a medium like sticky tape or glass. This way you can focus and create a sharp image. You can also make an image of pollen using an electron microscope. But this would take a lot of time since you need to make a complex preparation of the sample.

The microscopic view needs to be turned into a photo which can travel over the internet for step 3.

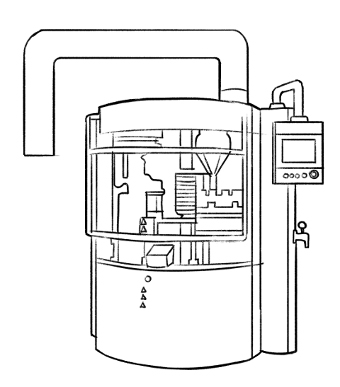
There are also other techniques to identify pollen, that don’t use the “visible part of the electromagnetic spectrum”. For instance, it is also possible to use more indirect techniques, a bit like looking at the shade instead of looking at the pollengrain itself. It’s for example possible to create a hologram or a spectral by using laser and UV. These devices are called flow cytometers. You don’t need sticky tape or glass to fix the pollen, as these techniques work directly in the airflow containing pollen. The output is more like a unique graph, which also needs to be analysed to identify the type of pollengrain.

Step 3: Recognition of pollen
This is where the real magic happens. Using artificial intelligence in the same way as face-recognition it’s possible to identify the specific species of pollen. The images, spectra or projections will be compared with a big set of images in a database. Is there a match? Is it pollen from birch, elder or grass? The one with the big ears might be from Pine trees, as they have two big air-sacs to support long distance traveling through air.


Step 4: Counting the pollen
For hayfever patiënts the concentration of pollen in the air is important to know. Often there is a small risk of triggering the hayfever because concentrations are pretty low. Like when it’s cold, raining, misty or very humid. Also the level of allergenicity varies between the types of pollen. Birch pollen is known te be pretty notorious. So counting the total amount of each type of pollen is important to be able make a hayfever forecast.

Step 5: Create an interface
This proces results in almost real-time pollen countings which can be visualised in many ways for instance using graphs or maps on websites and apps.

At the moment several organisations and companies are working on this fascinating technology and more systems are getting live. Hopefully it will help optimizing the models and forecasting. As pollenconcentrations vary a lot during the day and by location, live counting throughout the day is a valuable technique to make more accurate forecasts and models. The AutoPollen programme by Eumetnet aims to serve as a Proof-of-Concept for a European automatic pollen monitoring network using high temporal-resolution real-time measurements.
cartoons by Maarten Claassen